 |
| Market Cap | 5.49B | EPS (ttm) | 1.87 |
| P/E | 23.09 | EPS this Y | 2.60% |
| Forward P/E | 6.85 | EPS next Y | 35.93% |
| PEG | 1.45 | EPS past 5Y | -12.33% |
| P/S | 0.52 | EPS next 5Y | 15.96% |
| P/B | 1.37 | EPS Q/Q | 5.91% |
| Dividend | 0.37% | Sales Q/Q | 1.64% |
| Insider Own | 0.40% | Inst Own | 83.76% |
| Insider Trans | -1.25% | Inst Trans | 2.39% |
| Short Float | 5.24% | Earnings | Apr 18/b |
| Analyst Recom | 1.77 | Target Price | 55.80 |
| Avg Volume | 2.20M | 52W Range | 30.75 - 57.18 |
|
|
| Today | Upgrade |
Wolfe Research |
Peer Perform → Outperform |
$55 |
|
|
|
Alaska Air Group, Inc. is a holding company, which engages in the provision of air transportation services. It operates through the following segments: Mainline, Regional, and Horizon. The Mainline segment includes scheduled air transportation on Alaska's Boeing and Airbus jet aircraft for passengers and cargo throughout the U.S., and in parts of Mexico, Costa Rica and Belize. The Regional segment consists of Horizon's and other third-party carriers' scheduled air transportation for passengers across a shorter distance network within the U.S. and Canada under capacity purchase agreements (CPA). The Horizon segment encompasses the capacity sold to Alaska under a CPA. The company was founded in 1985 and is headquartered in Seattle, WA. |
| Insider Trading |
Relationship |
Date |
Transaction |
Cost |
#Shares |
Value ($) |
#Shares Total |
SEC Form 4 |
| VON MUEHLEN CONSTANCE E | EVP AND COO | Apr 03 '24 | Option Exercise | 0.00 | 4,110 | 0 | 17,401 | Apr 05 04:51 PM | | Berry Jason M | President, Horizon Air | Mar 20 '24 | Option Exercise | 0.00 | 696 | 0 | 939 | Mar 21 04:59 PM | | HARRISON ANDREW R | EVP AND CCO | Feb 28 '24 | Sale | 38.36 | 6,500 | 249,348 | 26,048 | Feb 29 06:43 PM | | MINICUCCI BENITO | CEO AND PRESIDENT | Feb 25 '24 | Option Exercise | 0.00 | 12,580 | 0 | 143,509 | Feb 27 04:08 PM | | TACKETT SHANE R | EVP AND CFO | Feb 09 '24 | Option Exercise | 0.00 | 7,240 | 0 | 28,062 | Feb 13 05:12 PM |
|
|
 |
 |
| Market Cap | 13.55B | EPS (ttm) | -0.43 |
| P/E | - | EPS this Y | 10.40% |
| Forward P/E | 31.30 | EPS next Y | 8.21% |
| PEG | - | EPS past 5Y | -39.52% |
| P/S | 12.26 | EPS next 5Y | 14.30% |
| P/B | 1.06 | EPS Q/Q | 102.74% |
| Dividend | - | Sales Q/Q | 20.98% |
| Insider Own | 57.57% | Inst Own | 45.47% |
| Insider Trans | 0.00% | Inst Trans | 17.11% |
| Short Float | 5.64% | Earnings | May 07/a |
| Analyst Recom | 2.30 | Target Price | 223.40 |
| Avg Volume | 231.12K | 52W Range | 161.32 - 224.77 |
|
|
| Today | Upgrade |
Berenberg |
Hold → Buy |
$185 → $255 |
|
|
|
Aspen Technology, Inc. engages in the development of software applications for asset performance and management monitoring. It operates through the following segments: OSI Inc., GSS Business, and Heritage AspenTech. The company was founded on August 12, 1981 and is headquartered in Bedford, MA. |
| Insider Trading |
Relationship |
Date |
Transaction |
Cost |
#Shares |
Value ($) |
#Shares Total |
SEC Form 4 |
| Whelan, Jr. Robert M. | Director | Jun 12 '23 | Option Exercise | 36.53 | 3,114 | 113,754 | 8,954 | Jun 14 04:06 PM | | Whelan, Jr. Robert M. | Director | Jun 12 '23 | Sale | 164.56 | 3,114 | 512,440 | 5,840 | Jun 14 04:06 PM | | Pietri Antonio J | President & CEO | May 30 '23 | Option Exercise | 83.15 | 4,806 | 399,617 | 167,323 | Jun 01 04:11 PM |
|
|
|
 |
| Market Cap | 11.01B | EPS (ttm) | 3.86 |
| P/E | 12.69 | EPS this Y | 0.97% |
| Forward P/E | 13.08 | EPS next Y | 13.36% |
| PEG | 2.53 | EPS past 5Y | - |
| P/S | 1.48 | EPS next 5Y | 5.02% |
| P/B | - | EPS Q/Q | 35.17% |
| Dividend | 1.72% | Sales Q/Q | 0.80% |
| Insider Own | 1.16% | Inst Own | 96.97% |
| Insider Trans | -0.63% | Inst Trans | -4.17% |
| Short Float | 2.97% | Earnings | Feb 29/b |
| Analyst Recom | 2.14 | Target Price | 50.75 |
| Avg Volume | 2.72M | 52W Range | 27.30 - 50.45 |
|
|
| Today | Upgrade |
JP Morgan |
Underweight → Neutral |
$40 → $53 |
|
|
|
Bath & Body Works, Inc. is a specialty retailers and home to America's Favorite Fragrances, offering a breadth of exclusive fragrances for the body and home, including the selling collections for fine fragrance mist, body lotion and body cream, 3-wick candles, home fragrance diffusers and liquid hand soap. The company was founded by Leslie Herbert Wexner in 1963 and is headquartered in Columbus, OH. |
| Insider Trading |
Relationship |
Date |
Transaction |
Cost |
#Shares |
Value ($) |
#Shares Total |
SEC Form 4 |
| Mazurek Thomas E. | Chief Supply Chain Officer | Mar 27 '24 | Option Exercise | 43.75 | 2,285 | 99,975 | 50,277 | Mar 28 06:10 PM | | Mazurek Thomas E. | Chief Supply Chain Officer | Mar 27 '24 | Sale | 48.89 | 4,285 | 209,515 | 45,992 | Mar 28 06:10 PM | | Nash Sarah E | Director | Mar 10 '24 | Option Exercise | 0.00 | 123,544 | 0 | 222,502 | Mar 12 05:00 PM | | Rosen Julie | President, Retail | Mar 01 '24 | Sale | 45.83 | 12,361 | 566,476 | 12,361 | Mar 05 05:26 PM | | Nash Sarah E | Director | Aug 20 '23 | Option Exercise | 0.00 | 3,770 | 0 | 99,565 | Aug 22 04:36 PM |
|
|
| |
 |
| Market Cap | 48.91B | EPS (ttm) | 5.01 |
| P/E | 39.78 | EPS this Y | 1773.79% |
| Forward P/E | 41.08 | EPS next Y | -30.07% |
| PEG | - | EPS past 5Y | - |
| P/S | 10.49 | EPS next 5Y | - |
| P/B | 6.06 | EPS Q/Q | 1390.11% |
| Dividend | - | Sales Q/Q | 201.18% |
| Insider Own | 29.36% | Inst Own | 40.99% |
| Insider Trans | -4.88% | Inst Trans | -0.30% |
| Short Float | 6.16% | Earnings | May 09/a |
| Analyst Recom | 2.50 | Target Price | 251.61 |
| Avg Volume | 11.84M | 52W Range | 46.43 - 283.48 |
|
|
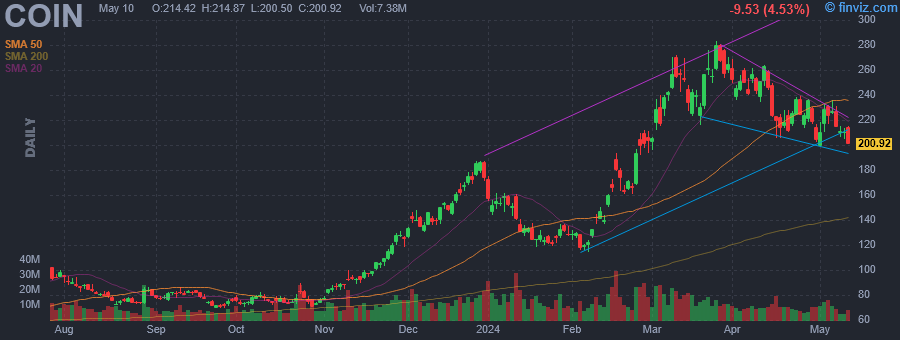
| Today | Upgrade |
BofA Securities |
Underperform → Neutral |
$110 → $217 |
|
|
|
Coinbase Global, Inc. engages in technology and financial infrastructure products and services. It offers crypto-powered technologies including self-custody wallets, decentralized apps and services, and open community engagement platforms. The company was founded by Brian Armstrong in May 2012 and is headquartered in Wilmington, DE. |
| Insider Trading |
Relationship |
Date |
Transaction |
Cost |
#Shares |
Value ($) |
#Shares Total |
SEC Form 4 |
| HAAS ALESIA J | Chief Financial Officer | May 15 '24 | Sale | 212.15 | 5,000 | 1,060,747 | 187,622 | May 15 04:08 PM | | Ehrsam Frederick Ernest III | Director | May 14 '24 | Sale | 202.30 | 114,216 | 23,106,367 | 0 | May 15 04:22 PM | | Choi Emilie | President & COO | May 14 '24 | Sale | 195.90 | 1,500 | 293,850 | 204,436 | May 15 04:24 PM | | Armstrong Brian | Chairman and CEO | May 13 '24 | Sale | 202.07 | 23,075 | 4,662,767 | 526 | May 15 04:16 PM | | Ehrsam Frederick Ernest III | Director | May 08 '24 | Sale | 212.08 | 16,380 | 3,473,915 | 0 | May 10 04:47 PM |
|
|
|
 |
| Market Cap | 18.07B | EPS (ttm) | 8.53 |
| P/E | 17.75 | EPS this Y | 10.57% |
| Forward P/E | 15.79 | EPS next Y | 8.39% |
| PEG | 1.76 | EPS past 5Y | 11.05% |
| P/S | 1.61 | EPS next 5Y | 10.06% |
| P/B | 8.29 | EPS Q/Q | 11.08% |
| Dividend | 3.48% | Sales Q/Q | 6.77% |
| Insider Own | 0.38% | Inst Own | 97.59% |
| Insider Trans | -8.50% | Inst Trans | -1.13% |
| Short Float | 5.19% | Earnings | Mar 21/b |
| Analyst Recom | 1.93 | Target Price | 178.68 |
| Avg Volume | 1.29M | 52W Range | 133.36 - 176.84 |
|
|
| Today | Upgrade |
BTIG Research |
Neutral → Buy |
$175 |
|
|
|
Darden Restaurants, Inc. is a full-service restaurant company, which engages in the provision of restaurant services. It operates through the following segments: Olive Garden, LongHorn Steakhouse, Fine Dining, and Other Business. The Olive Garden segment is the largest full-service dining Italian restaurant operator. The LongHorn Steakhouse segment includes the results of the company-owned LongHorn Steakhouse restaurants. The Fine Dining segment consists of the premium brands that operate within the fine-dining sub-segment of full-service dining and includes the results of its company-owned The Capital Grille and Eddie V's restaurants. The Other Business segment aggregates the remaining brands and includes the results of its company-owned Cheddar's Scratch Kitchen, Yard House, Seasons 52 and Bahama Breeze restaurants, and from franchises and consumer-packaged goods sales. The company was founded by William B. Darden in 1938 and is headquartered in Orlando, FL. |
| Insider Trading |
Relationship |
Date |
Transaction |
Cost |
#Shares |
Value ($) |
#Shares Total |
SEC Form 4 |
| Broad Matthew R | SVP General Counsel | Apr 25 '24 | Option Exercise | 85.83 | 4,707 | 404,002 | 23,886 | Apr 26 12:42 PM | | Broad Matthew R | SVP General Counsel | Apr 25 '24 | Sale | 156.15 | 4,707 | 735,011 | 19,179 | Apr 26 12:42 PM | | Simon William S | Director | Apr 08 '24 | Sale | 158.21 | 1,219 | 192,858 | 6,281 | Apr 09 02:34 PM | | Martin Melvin John | President, SRG | Mar 28 '24 | Sale | 167.62 | 3,100 | 519,622 | 14,108 | Mar 29 02:40 PM | | Martin Melvin John | President, SRG | Mar 27 '24 | Option Exercise | 85.83 | 7,673 | 658,574 | 24,881 | Mar 29 02:40 PM |
|
|
| |
 |
| Market Cap | 32.43B | EPS (ttm) | 0.81 |
| P/E | 95.46 | EPS this Y | 4.31% |
| Forward P/E | 18.09 | EPS next Y | 18.11% |
| PEG | 9.03 | EPS past 5Y | -28.34% |
| P/S | 2.71 | EPS next 5Y | 10.58% |
| P/B | 1.38 | EPS Q/Q | -20.24% |
| Dividend | 1.96% | Sales Q/Q | -2.88% |
| Insider Own | 0.27% | Inst Own | 72.89% |
| Insider Trans | -1.93% | Inst Trans | 0.20% |
| Short Float | 1.09% | Earnings | May 01/b |
| Analyst Recom | 2.00 | Target Price | 86.20 |
| Avg Volume | 2.34M | 52W Range | 61.14 - 79.63 |
|
|
| Today | Upgrade |
Jefferies |
Hold → Buy |
$78 → $101 |
|
|
|
DuPont de Nemours, Inc. is a holding company, which engages in the development of specialty materials, chemicals, and agricultural products. It operates through the following segments: Electronics and Industrial, Water and Protection, and Corporate and Others. The Electronics and Industrial segment involves the supply of differentiated materials and systems for a broad range of consumer electronics including mobile devices, television monitors, personal computers and electronics used in a variety of industries. The Water and Protection segment focuses on the provision of engineered products and integrated systems for many industries including worker safety, water purification and separation, aerospace, energy, medical packaging and building materials. The company was founded in 1897 and is headquartered in Wilmington, DE. |
| Insider Trading |
Relationship |
Date |
Transaction |
Cost |
#Shares |
Value ($) |
#Shares Total |
SEC Form 4 |
| Goss Michael G. | Controller | May 09 '24 | Sale | 78.33 | 1,339 | 104,884 | 14,012 | May 10 04:18 PM | | Weaver Leland | President, Water & Protection | May 06 '24 | Sale | 78.40 | 18,500 | 1,450,400 | 24,476 | May 07 04:18 PM | | Goss Michael G. | Controller | Mar 13 '24 | Sale | 72.80 | 2,354 | 171,371 | 15,587 | Mar 14 04:16 PM | | Larrabee Steven P. | SVP & CIO | Nov 14 '23 | Sale | 70.57 | 3,700 | 261,109 | 29,418 | Nov 15 04:13 PM | | Ratnakar Raj | SVP & Chief Strategy Officer | Aug 31 '23 | Option Exercise | 66.06 | 50,633 | 3,344,816 | 82,353 | Sep 05 04:49 PM |
|
|
|
 |
| Market Cap | 5.29B | EPS (ttm) | 5.66 |
| P/E | 20.36 | EPS this Y | 16.00% |
| Forward P/E | 11.87 | EPS next Y | 12.19% |
| PEG | 1.36 | EPS past 5Y | 5.24% |
| P/S | 1.41 | EPS next 5Y | 15.00% |
| P/B | 4.25 | EPS Q/Q | 45.89% |
| Dividend | - | Sales Q/Q | 8.87% |
| Insider Own | 7.36% | Inst Own | 92.31% |
| Insider Trans | 0.00% | Inst Trans | 1.17% |
| Short Float | 1.69% | Earnings | May 01/b |
| Analyst Recom | 1.91 | Target Price | 124.50 |
| Avg Volume | 268.86K | 52W Range | 73.84 - 121.55 |
|
|
| Today | Upgrade |
Wolfe Research |
Underperform → Peer Perform |
|
|
|
|
Euronet Worldwide, Inc. engages in the provision of electronic payment and transaction processing and distribution solutions. Its products and services include automated teller machine (ATM), point-of-sale (POS), card outsourcing, card issuing and merchant acquiring services, software solutions and cloud based payment solutions, electronic distribution of electronic payment products, foreign exchange services, and international payment services. It operates through the following segments: Electronic Fund Transfer (EFT) Processing, Epay, Money Transfer, and Corporate Services, Eliminations, and Other. The EFT Processing provides electronic payment solutions consisting of ATM cash withdrawal and deposit services, ATM network participation, outsourced ATM and POS management solutions, credit and debit card outsourcing, and card issuing and merchant acquiring services. The Epay segment offers prepaid mobile airtime and other electronic content and payment processing services for various prepaid products, cards, and services throughout its worldwide distribution network. The Money Transfer segment refers to money transfer services, primarily under the brand names Ria, AFEX Money Express, and IME, and global account-to-account money transfer services under the brand names HiFX and xe. The Corporate Services, Eliminations, and Other segment provides corporate and other administrative services to the operating segments, including most share-based compensation expense. The company was founded by Daniel R. Henry and Michael J. Brown in 1994 and is headquartered in Leawood, KS. |
| Insider Trading |
Relationship |
Date |
Transaction |
Cost |
#Shares |
Value ($) |
#Shares Total |
SEC Form 4 |
| Fountas Nikos | CEO, EFT EMEA Division | Dec 07 '23 | Option Exercise | 45.93 | 18,991 | 872,257 | 50,520 | Dec 08 04:42 PM | | WELLER RICK | EVP - Chief Financial Officer | Dec 06 '23 | Option Exercise | 45.93 | 27,130 | 1,246,081 | 263,911 | Dec 08 04:40 PM | | Brown Michael J | CEO & President | Dec 04 '23 | Option Exercise | 45.93 | 59,324 | 2,724,751 | 1,553,185 | Dec 05 05:38 PM | | Brown Michael J | CEO & President | Oct 13 '23 | Option Exercise | 45.93 | 8,500 | 390,405 | 1,493,861 | Oct 16 03:49 PM | | Brown Michael J | CEO & President | May 22 '23 | Sale | 120.69 | 50,000 | 6,034,565 | 1,487,361 | May 24 01:02 PM |
|
|
| |
 |
| Market Cap | 48.34B | EPS (ttm) | 2.21 |
| P/E | 15.50 | EPS this Y | 5.53% |
| Forward P/E | 9.61 | EPS next Y | 10.05% |
| PEG | 0.88 | EPS past 5Y | - |
| P/S | 0.31 | EPS next 5Y | 17.70% |
| P/B | 1.52 | EPS Q/Q | 9.64% |
| Dividend | 1.87% | Sales Q/Q | 1.88% |
| Insider Own | 0.68% | Inst Own | 18.46% |
| Insider Trans | 0.00% | Inst Trans | -11.13% |
| Short Float | 2.29% | Earnings | May 16/b |
| Analyst Recom | 1.50 | Target Price | 39.63 |
| Avg Volume | 13.78M | 52W Range | 20.82 - 41.95 |
|
|
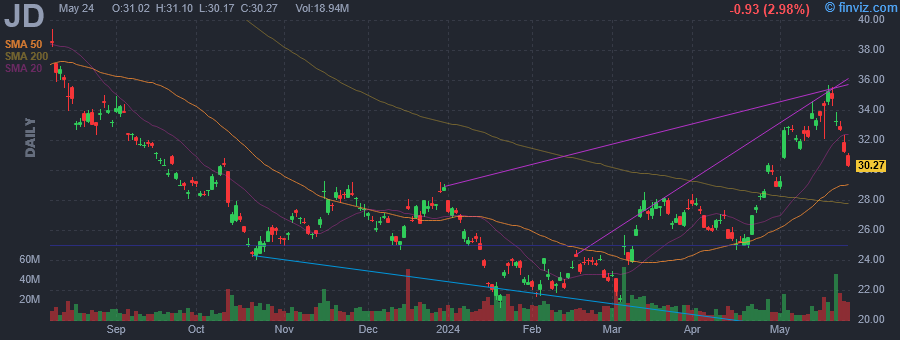
| Today | Upgrade |
Macquarie |
Neutral → Outperform |
$26 → $40 |
|
|
|
JD.com, Inc. is a technology-driven E-commerce company, which engages in the sale of electronics products and general merchandise products, including audio, video products, and books. It operates in the following segments: JD Retail, JD Logistics, and New Businesses. The JD Retail segment offers online retail, online marketplace, and marketing services. The JD Logistics segment includes internal and external logistics businesses. The New Businesses segment is composed of JD Property, Jingxi, overseas businesses and technology initiatives. The company was founded on June 18, 1998, by Qiang Dong Liu and is headquartered in Beijing, China. |
|
|
 |
| Market Cap | 6.18B | EPS (ttm) | 8.73 |
| P/E | 28.58 | EPS this Y | -27.84% |
| Forward P/E | 22.23 | EPS next Y | 32.44% |
| PEG | 2.78 | EPS past 5Y | 9.65% |
| P/S | 2.70 | EPS next 5Y | 10.30% |
| P/B | 2.51 | EPS Q/Q | -45.54% |
| Dividend | 1.06% | Sales Q/Q | -12.20% |
| Insider Own | 1.09% | Inst Own | 96.68% |
| Insider Trans | -7.30% | Inst Trans | -4.61% |
| Short Float | 1.44% | Earnings | Apr 30/a |
| Analyst Recom | 2.71 | Target Price | 258.75 |
| Avg Volume | 154.90K | 52W Range | 212.80 - 309.94 |
|
|
| Today | Upgrade |
Robert W. Baird |
Neutral → Outperform |
$270 → $300 |
|
|
Today 07:20AM
|
Baird Upgrades Littelfuse to Outperform From Neutral, Raises Price Target to $300 From $270
(MT Newswires) |
|
May-14-24 09:45AM
|
Littelfuse Inc /de Insider Sold Shares Worth $1,568,208, According to a Recent SEC Filing
(MT Newswires) |
|
May-09-24 01:01PM
|
Insider Sale: EVP, Chief Legal Officer & Corporate Secretary Ryan Stafford Sells Shares of ...
(GuruFocus.com) |
|
10:12AM
|
Littelfuse Insider Sold Shares Worth $568,796, According to a Recent SEC Filing
(MT Newswires) |
|
May-06-24 02:06PM
|
Littelfuse Insider Sold Shares Worth $326,571, According to a Recent SEC Filing
(MT Newswires) |
|
May-02-24 01:12PM
|
Littelfuse, Inc. (NASDAQ:LFUS) Q1 2024 Earnings Call Transcript
(Insider Monkey) |
|
03:19AM
|
Littelfuse Inc (LFUS) Q1 2024 Earnings Call Transcript Highlights: Navigating Market Challenges ...
(GuruFocus.com) |
|
01:30AM
|
Q1 2024 Littelfuse Inc Earnings Call
(Thomson Reuters StreetEvents) |
|
May-01-24 03:17PM
|
Analyst Report: Littelfuse, Inc.
(Morningstar Research) |
|
Apr-30-24 09:53PM
|
LFUS Stock Earnings: Littelfuse Beats EPS, Beats Revenue for Q1 2024
(InvestorPlace) |
|
Littelfuse, Inc. is an industrial technology manufacturing company, which engages in the business of designing, manufacturing, and selling electronic components, modules, and subassemblies to empower the long-term secular growth themes of sustainability, connectivity, and safety. It operates through the following segments: Electronics, Transportation, and Industrial. The Electronics segment includes a broad range of end markets including industrial motor drives, power conversion, automotive electronics, electric vehicle and related charging infrastructure, aerospace, power supplies, data centers and telecommunications, medical devices, alternative energy and energy storage, building and home automation, appliances, and mobile electronics. The Transportation segment focuses on circuit protection, power control, and sensing technologies for global original equipment manufacturers, tier-one suppliers and parts, and aftermarket distributors in passenger vehicle, heavy-duty truck and bus, off-road and recreational vehicles, material handling equipment, agricultural machinery, construction equipment, and other commercial vehicle end markets. The Industrial segment offers industrial circuit protection, industrial controls, and temperature sensors for use in various applications such as renewable energy and energy storage systems, industrial safety, factory automation, electric vehicle infrastructure, HVAC systems, non-residential construction, MRO, and mining. The company was founded by Edward V. Sundt in 1927 and is headquartered in Chicago, IL. |
| Insider Trading |
Relationship |
Date |
Transaction |
Cost |
#Shares |
Value ($) |
#Shares Total |
SEC Form 4 |
| Sethna Meenal | Executive VP, CFO | May 14 '24 | Option Exercise | 192.59 | 3,031 | 583,740 | 25,463 | May 15 10:49 AM | | Sethna Meenal | Executive VP, CFO | May 14 '24 | Sale | 258.59 | 3,031 | 783,788 | 22,432 | May 15 10:49 AM | | Sethna Meenal | Executive VP, CFO | May 13 '24 | Option Exercise | 192.59 | 6,114 | 1,177,495 | 28,546 | May 14 09:15 AM | | Sethna Meenal | Executive VP, CFO | May 13 '24 | Sale | 256.49 | 6,114 | 1,568,208 | 22,432 | May 14 09:15 AM | | Stafford Ryan K | EVP, CLO & Corp Secretary | May 08 '24 | Sale | 256.33 | 2,219 | 568,796 | 24,437 | May 09 10:08 AM |
|
|
|
 |
| Market Cap | 15.73B | EPS (ttm) | 0.15 |
| P/E | 123.02 | EPS this Y | 182.96% |
| Forward P/E | 34.48 | EPS next Y | 2.58% |
| PEG | - | EPS past 5Y | -48.35% |
| P/S | 7.62 | EPS next 5Y | - |
| P/B | 2.28 | EPS Q/Q | 131.49% |
| Dividend | - | Sales Q/Q | 39.60% |
| Insider Own | 49.16% | Inst Own | 45.42% |
| Insider Trans | -0.89% | Inst Trans | 4.24% |
| Short Float | 6.91% | Earnings | May 08/a |
| Analyst Recom | 2.89 | Target Price | 20.30 |
| Avg Volume | 15.86M | 52W Range | 7.91 - 20.55 |
|
|
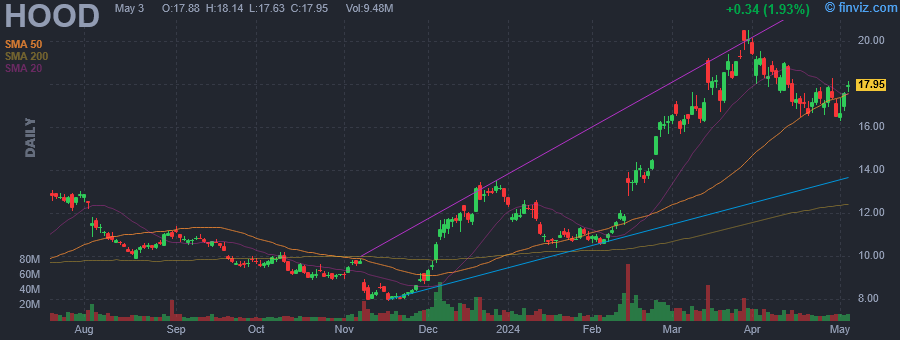
| Today | Upgrade |
BofA Securities |
Underperform → Buy |
$14 → $24 |
|
|
|
Robinhood Markets, Inc is a financial services platform that pioneered commission-free stock trading with no account minimums and fractional share trading. The firm is focused on providing retail brokerage and offers trading in U.S. listed stocks and Exchange Traded Funds, related options, and cryptocurrency trading, as well as cash management, which includes debit cards services. The company was founded by Vladimir Tenev and Baiju Prafulkumar Bhatt in 2013 and is headquartered in Menlo Park, CA. |
| Insider Trading |
Relationship |
Date |
Transaction |
Cost |
#Shares |
Value ($) |
#Shares Total |
SEC Form 4 |
| Bhatt Baiju | Director | May 10 '24 | Sale | 16.63 | 153,180 | 2,547,138 | 0 | May 14 06:38 PM | | Tenev Vladimir | Chief Executive Officer | May 06 '24 | Sale | 17.93 | 250,000 | 4,481,850 | 0 | May 08 07:44 PM | | Gallagher Daniel Martin Jr | Chief Legal Officer | May 03 '24 | Sale | 17.83 | 12,500 | 222,862 | 854,995 | May 07 07:11 PM | | Tenev Vladimir | Chief Executive Officer | May 02 '24 | Sale | 17.04 | 25,049 | 426,875 | 32,584 | May 03 07:19 PM | | Warnick Jason | Chief Financial Officer | May 01 '24 | Sale | 16.72 | 5,000 | 83,602 | 997,407 | May 03 07:14 PM |
|
|
|
